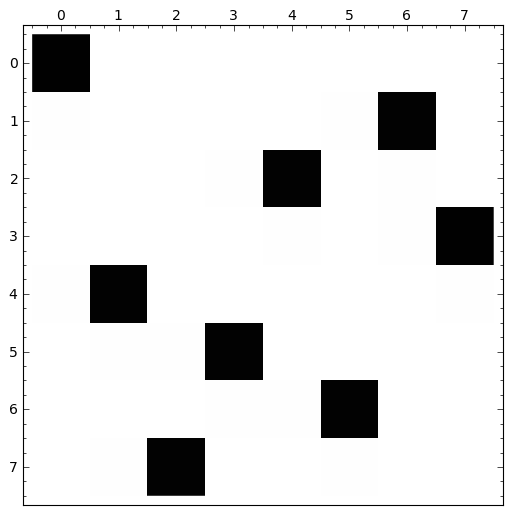
for l in permutations(range(8)):
if all([ abs(l[i]-l[j]) != i-j or i == j for i in range(8) for j in range(8) ]):
show(matrix_plot([[ l[i]!=j for i in range(8)] for j in range(8)]))
break
|
|
var('x,a,b,c,d')
show(solve(a*x^2+b*x+c==0,x))
|
diff(tan(x),x)
tan(x)^2 + 1 |
show(diff(tan(x),x,8))
|
integral(sin(6*x),x)
-1/6*cos(6*x) |
sum(1/x^2,x,1,infinity)
1/6*pi^2 |
limit(sin(x)/x,x=0)
1 |
plot(sin(x), x, 0, 2*pi)
|
|
.png)
animate([sin(x + float(k)) for k in [0,0.3,..,2*pi]], xmin=0, xmax=2*pi).show()
|
plot(sin(x), x, 0, 2*pi).save("sin.pdf")
var('x,y');
plot3d(sin(x-y)*y*cos(x),(x,-3,3),(y,-3,3))
sum( [ point( [cos(t), sin(t), t]) for t in [0,0.1,..10] ])
taylor(sin(x),x,1,3)
-1/6*(x - 1)^3*cos(1) - 1/2*(x - 1)^2*sin(1) + (x - 1)*cos(1) + sin(1) |
show(_)
|
sum([ plot(taylor(sin(x),x,1,k),x,-2,2,rgbcolor=[k/10,0,0]) for k in [1..10]]) + plot(sin(x),x,-2,2)
|
|
.png)
factor(19753908033962706153880721511761)
238749823749839 * 82738942897234399 |
M=matrix([[1,2,3],[4,5,6],[11,11,12]])
M.determinant()
-3 |
M^-1
[ 2 -3 1] [ -6 7 -2] [ 11/3 -11/3 1] |
G=graphs.DodecahedralGraph()
G
Dodecahedron: Graph on 20 vertices |
G.plot(partition=G.coloring())
|
|
.png)
G.show3d(vertex_colors=dict([((random(),random(),random()),i) for i in G.coloring()]))
@interact
def tangent_line(f = input_box(default=sin(x),label="f(x) ="), x0 = slider(-5, 5, 1/100, 7/4,label="x<sub>0</sub>")):
xbegin = -5
xend = 5
var('x')
df = diff(f,x)
tanf = f(x=x0) + df(x=x0)*(x-x0)
fplot = plot(f, xbegin, xend)
html('Érintő egyenes: l(x) = $'+latex(f(x=x0))+' + '+latex(df(x=x0))+'\\cdot (x-'+latex(x0)+') '+'$')
tanplot = plot(tanf, (x,xbegin, xend), rgbcolor = (1,0,0))
fmax = f.find_maximum_on_interval(xbegin, xend)[0]
fmin = f.find_minimum_on_interval(xbegin, xend)[0]
show(fplot + tanplot+point((x0,f(x=x0))), xmin = xbegin, xmax = xend, ymax = fmax, ymin = fmin)
|
|||||||||||||||||||
.png)
%gap
G := Group((1,2)(3,4),(1,2,3));
T := CharacterTable(G);
Display(T);
Group([ (1,2)(3,4), (1,2,3) ])
CharacterTable( Alt( [ 1 .. 4 ] ) )
CT1

     2  2  2  .  .
     3  1  .  1  1

       1a 2a 3a 3b
    2P 1a 1a 3b 3a
    3P 1a 2a 1a 1a

X.1     1  1  1  1
X.2     1  1  A /A
X.3     1  1 /A  A
X.4     3 -1  .  .

A = E(3)^2
  = (-1-ER(-3))/2 = -1-b3
|
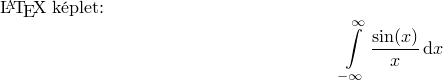
%latex
\LaTeX\ képlet:
\[ \int\limits_{-\infty}^{\infty} \frac{\sin(x)}x\, \mathrm{d}x \]
|
t = Tachyon(camera_center=(8.5,5,5.5), look_at=(2,0,0), raydepth=6, xres=1500, yres=1500)
t.light((10,3,4), 1, (1,1,1))
t.texture('mirror', ambient=0.05, diffuse=0.05, specular=.9, opacity=0.9, color=(.8,.8,.8))
t.texture('grey', color=(.8,.8,.8), texfunc=7)
t.plane((0,0,0),(0,0,1),'grey')
t.sphere((4,-1,1), 1, 'mirror')
t.sphere((0,-1,1), 1, 'mirror')
t.sphere((2,-1,1), 0.5, 'mirror')
t.sphere((2,1,1), 0.5, 'mirror')
show(t)
.png)
|
var("u,v")
p1 = parametric_plot3d([cos(u)*v, sin(u)*v, 3/2-3*v/2], (u, 0, 2*pi), (v, 0, 1.5), opacity = 0.5, plot_points=[20,20])
p2 = parametric_plot3d([cos(u)/2, sin(u)/2, v-3/4], (u, 0, 2*pi), (v, 0, 3/2), plot_points=[20,20])
show(p1+p2)
N=200
M1=200
M2=200
x0=0.509434
puntos=[]
for t in range(N):
mu=2.0+2.0*t/N
x=x0
for i in range(M1):
x=mu*x*(1-x)
for i in range(M2):
x=mu*x*(1-x)
puntos.append((mu,x))
point(puntos,pointsize=1)
|
|
.png)
"""
Draws Loretz butterfly using matplotlib (2d) or jmol (3d).
Written by Matthew Miller and William Stein.
"""
g = Graphics()
x1, y1 = 0, 0
from math import sin, cos, exp, pi
for theta in srange( 0, 10*pi, 0.05 ):
r = exp(cos(theta)) - 2*cos(4*theta) + sin(theta/12)^5
x = r * cos(theta) # Convert polar to rectangular coordinates
y = r * sin(theta)
xx = x*6 + 25 # Scale factors to enlarge and center the curve.
yy = y*6 + 25
if theta != 0:
l = line( [(x1, y1), (xx, yy)], rgbcolor=hue(theta/7 + 4) )
g = g + l
x1, y1 = xx, yy
g.show(dpi=100, axes=False)
|
|
.png)
r = RubiksCube().move("R U R'")
r.show3d()
|
|
|
|
|
|